The Effect Of Height On Stomatal Density

Summary

Mahonia Aquifolium located outside bus loop Evergreen State College

We are researching stomatal density on different tiers of leaves in Mahonia Aquifolium, also known as Oregon grape. This research will be able to tell us if Oregon grapes adapts to have more or less stomata when needed. The higher the amount of stomata means more CO2 intake and photosynthesis. We know that the higher tiers of Oregon grape cover the lower tiers; and because of this we also know that the lower tiers see less light than the ones above them. Now, our question is, will the higher tiers of leaves have more or less stomatal density than those below it? By establishing an experiment with Oregon grape we will be able to analyze stomatal density vs. tier to create a bar graph showing our data and results.

Intro / Project Background

We hypothesize that the stomatal density of leaves in Mahonia Aquifolium will be greater in the leaves higher up from the ground opposed to the ones lower to

Clear nail polish on Mahonia Aquifolium leaflet to make a cast of stomata

the ground. We predict there will be more stomata on the higher leaves because they see significantly more sun than the underlying leaves. We believe that the higher up leaves seen more sun, therefore have a higher light intake. With a higher light intake we think that the plant needs more stomata on those leaves to be able to conduct photosynthesis more efficiently. According to Keith Mott and Odette Michaelson (Jan. 1991), more light means there will be a higher rate of photosynthesis. Although when comparing stomatal density to light intake they didn’t see any significant change between the three different levels of light. To

Stomata of Mahonia Aquifolium 400x

counteract this, H. P. Gay and R. G. Hurd found that in a tomato plant there was a higher stomatal density on the top tier leaves; and a lower stomatal density on the leaves closer to the ground. Although there was some variation within the levels of the different leaves, overall the pattern showed a significant difference between the leaves closest to the ground and the ones highest up. In our research, we use the light of the sun, also known as white light. In a study done by Andrew O’Carrigan, Mohammad Babla, Feifei Wang, Xiaohui Liu, Michelle Mak, Richard Thomas, Bill Bellotti, and Zhong-Hua Chen, they conducted a few different experiments with different colors of light to see the response plants had and in what way. They found that in blue light, the stomata was much bigger than it was in red or green light. In our research we will be doing two different comparisons of data. The first set of we collect the tiers of leaves will be as close together as possible. This is data 1-9 and 20-24. The second set of data we collect, the tiers will be from the highest and lowest point on the plant as well as one tier from the middle.This is data 10-19 and 25-30. With some variation in data, we hope to see a difference overall in stomatal density from the higher up leaves rather than the lower. We hypothesize there will be a larger difference in stomatal density when there is a more drastic height difference of each tier.

Methods

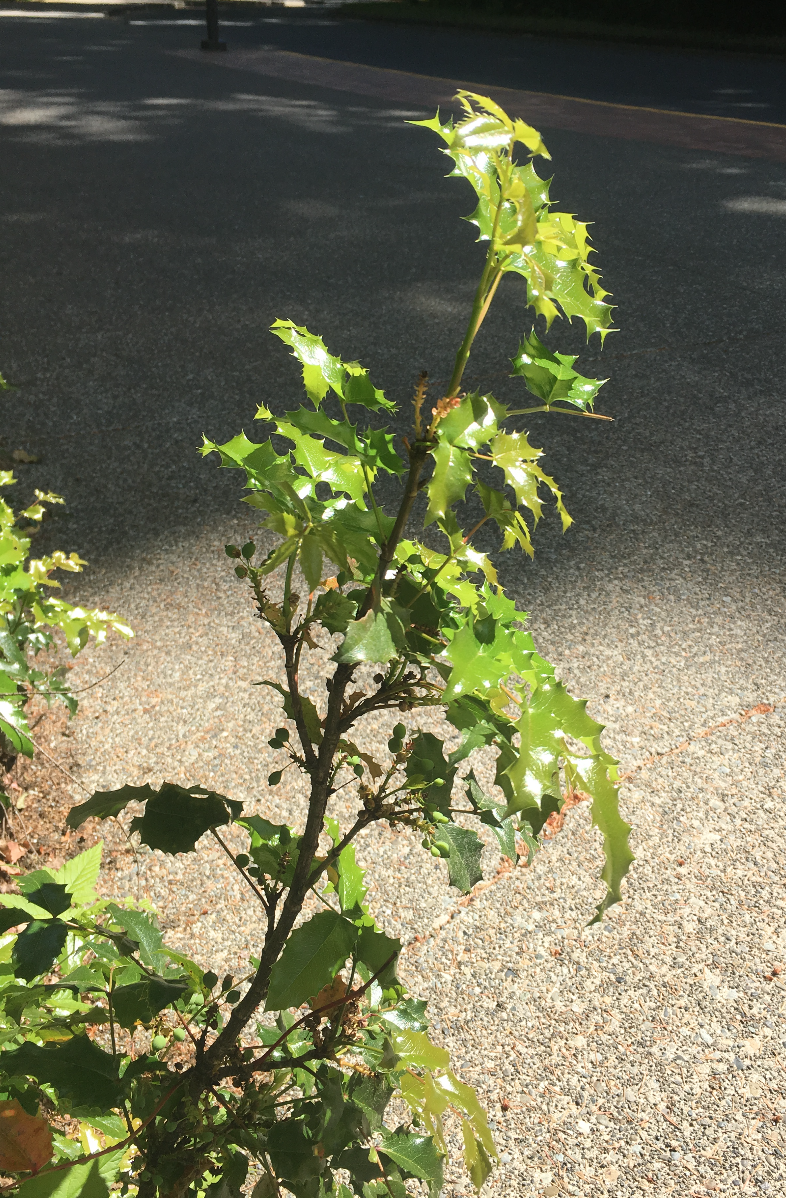
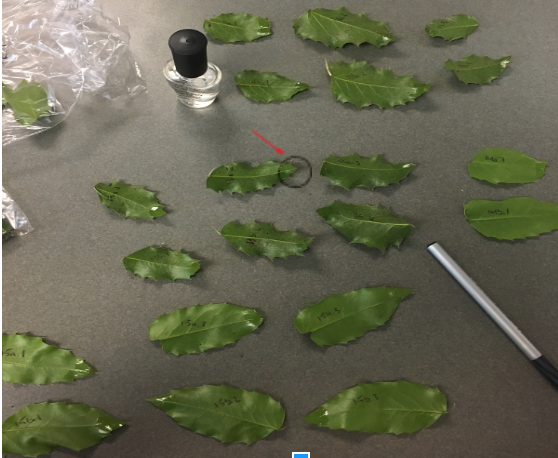
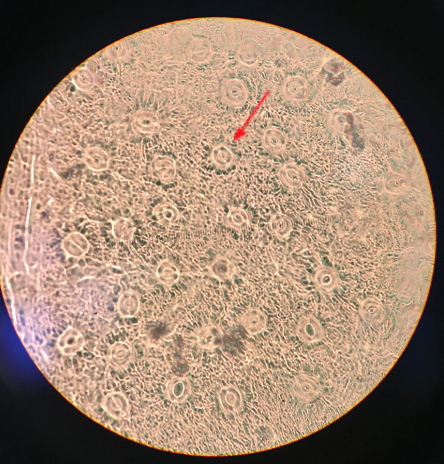
The map below shows where on The Evergreen State campus we are collecting our samples from. We gathered two samples from each of the three tiers of 30 different Oregon grape plants. Samples were collected from the middle of each sporophyte. The three tiers from each sample from samples 1-9 and 20-24 were tiers directly below or above each other, with no other sporophytes in between. For samples 10-19 and 25-30, tier one was the highest on the plant, tier two was in the middle and tier three was the lowest sporophyte of each plant. After collecting all of our 180 samples we brought them to the lab to analyze. By painting each tip of the leaf with a layer of clear nail polish (see in picture to right) then removing it with clear tape, we were able to determine the amount of stomata on each leaf. Video example. After getting a slide prepared and ready to view under the compound microscope, we used a 400x magnification and were able to count the stomata. Microscope setup instructions. The picture to the left is a microscopic image of a leaf from Mahonia Aquifolium. The picture shows us the stomata and with that we are able to tell if they are open or closed, as well as the amount of stomata. In this exact picture, we estimated about 32 stomata. After we got the number of stomata then found the stomatal density by dividing the number of stomata found by the area seen under the microscope. Bruce Grant and Itzick Vatnick do a great job of explaining all the calculations used in this experiment with step by step instructions in their article, Environmental Correlates of Leaf Stomata Density.

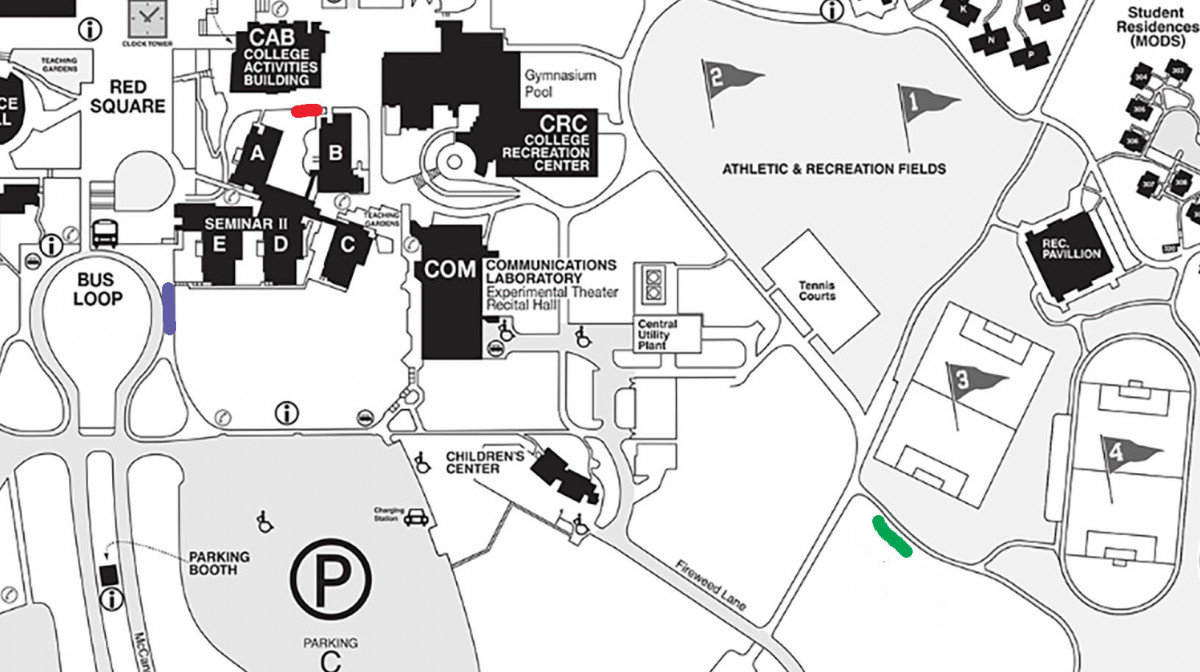
Red Plot = Samples 20-24 Purple Plot = Samples 5-14, 25-30 Green Plot = Samples 1-4

Results

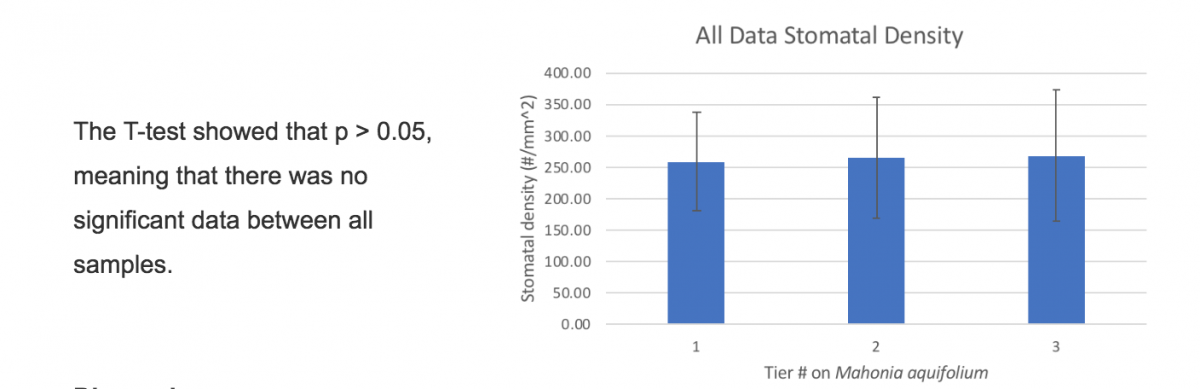
Our data found did not prove or disprove our hypothesis. Although we did not find what we were expecting, we found that there was no overall difference in data. The number of stomata on each leaf, throughout different heights on the plant had no significant difference from one another, meaning no change. Any outliers over 100 stomata per field of view were taken out of our data. Below is a data set for the stomatal density of leaves taken from different tiers of Mahonia Aquifolium (Oregon Grape). Data taken from Evergreen State College and Tumwater Falls (highlighted on map above) spring of 2018. The stomata were counted at 400x, the estimated area of the field of view was calculated to be .1589 mm^2. 
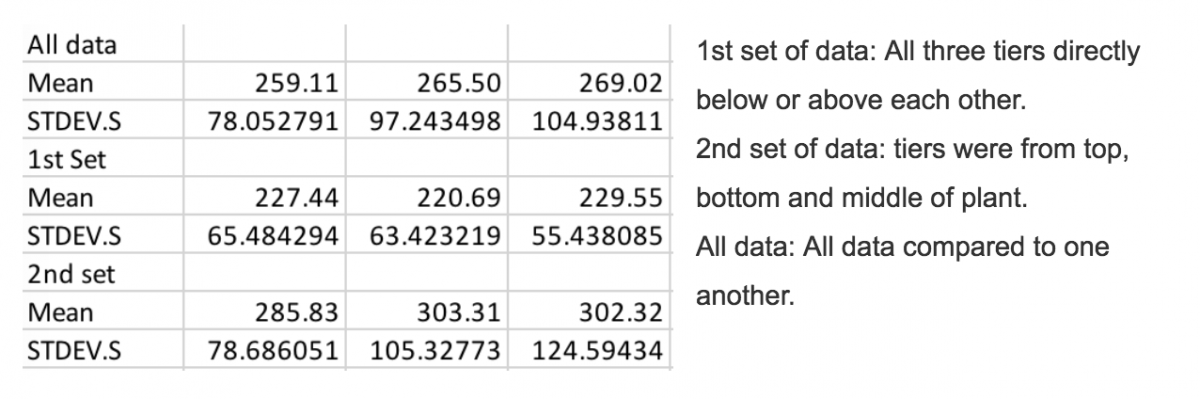


Discussion

In this study, the height of the leaves on Mahonia Aquifolium did not affect the stomatal density.

We hypothesized that the stomatal density of leaves in Mahonia Aquifolium would be greater in the leaves higher up from the ground opposed to the ones lower to the ground. We then predicted that there would be more stomata on the higher leaves because they see significantly more sun than the underlying leaves. Although, this is not what we found. For future research, we would need to measure the distance from the ground to each and every tier of leaves. This would give us a larger field of view on exactly which leaves at which tier had a certain amount of stomata. Instead, what we failed on was only taking data from 3 tiers and then finding the mean of the data on each tier. If we were to stay with Mahonia Aquifolium I don’t believe we would see much of a difference either way. Partially because Mahonia Aquifolium only has a certain number of tiers on the plant which happen to be on the lower side. To continue this research would mean gathering more data altogether. For more accurate results, I would prefer to take images of the microscopic stomata to be able to count more accurately. I believe eyesight counting had a huge effect on our data and is unreliable.   

References

Gay, A. P., and R. G. Hurd. “The Influence Of Light On Stomatal Density In The Tomato.” New Phytologist, vol. 75, no. 1, 1975, pp. 37–46., doi:10.1111/j.1469-8137.1975.tb01368.x.

Mott, Keith A., and Odette Michaelson. “Amphistomy as an Adaptation to High Light Intensity in Ambrosia Cordifolia (Compositae).” American Journal of Botany, vol. 78, no. 1, 1991, p. 76., doi:10.2307/2445230.

Grant, Bruce W, and Itzick Vatnick. Teaching Issues and Experiments in Ecology . Vol. 1, Widener University, 2014.

Ocarrigan, Andrew, et al. “Analysis of Gas Exchange, Stomatal Behaviour and Micronutrients Uncovers Dynamic Response and Adaptation of Tomato Plants to Monochromatic Light Treatments.” Plant Physiology and Biochemistry, vol. 82, 2014, pp. 105–115., doi:10.1016/j.plaphy.2014.05.012.

Peñuelas, Josep, and Roser Matamala. “Changes in N and S Leaf Content, Stomatal Density and Specific Leaf Area of 14 Plant Species during the Last Three Centuries of CO2Increase.” Journal of Experimental Botany, vol. 41, no. 9, 1990, pp. 1119–1124., doi:10.1093/jxb/41.9.1119.

Xylem and Phloem: A Plants Source and Sink

Ever think what it would be like to just have a faucet with no sink? Or Vise versa? You can’t have one without the other, kind of like xylem and phloem. They are vital for a vascular plants survival, growth and reproduction. Coupled together never leaving one anothers sides they are the heart and lungs, the source and sink, the sun and the moon. Although not always studied together, xylem has been more broadly studied partially because phloem it’s harder to measure. Xylem is involved in the movement of water through the plants from the roots to leaves. Phloem is involved in translocation, which is the movement of food from the stem to growing tissue and storage tissue. One xylem and one phloem make up a vascular bundle (as seen in the picture). These vascular bundles run all throughout the plant. Even though most plants use photosynthesis as a source for nutrients there still can be non-photosynthesizing tissues within plants, like the roots and stems. One of the jobs of phloem is to transport food produced by photosynthesis from the leaves to the non photosynthesizing parts. When I talk about source and sink I refer to different parts of the plants and it also has to do with phloem. According to BasicBiology, the sugars sources are the plants organs that produce sugar, such as the leaves. The sugar sinks are the plant organs that consume or store sugar, such as the roots. In the picture to the left it shows how the source and the sink work and in what directions they flow. For nutrients to originally get into the phloem it has to go through the companion cell and the casparian strip. There are three ways this can happen: symplastically, apoplastically or transcellular. The final stage is to pass through the casparian strip which is like a filter, filtering out unwanted nutrients. Just as humans have hearts, veins and organs; plants have similar systems in which they use to keep themselves running and alive. Although that being said, not all plants have vascular systems, but they still have ways to transport the necessary amounts of food and nutrients. An easy way to think about the source and sink, is to think about a human eating food. The food in your mouth is the source, and your stomach is the sink. Even though it’s much more complicated than that it’s still a good way to picture it. If your still confused, below is a video by FuseSchool who have a great explanation on xylem and phloem and the transportation in plants. 

Click here for a list of sources used


They Bark and They Bite

What’s green, grows in swamps and eats bugs? The venus fly trap. Unique to its kind the venus fly trap catches, traps and digests its prey. When starving, the venus fly trap develops intensely red colored traps to attract insects. The mechanics of this plant closing its “mouth” are quite unique and very interesting. It has sensory trigger hairs which close when contact has been made. The Venus fly trap relies on a electrical circuit which sends electrical signals to tell it when to open or close, the signal is all or nothing with no inbetween. According to Rainer Hedrich, and Erwin Neher who wrote Venus Flytrap: How an Excitable, Carnivorous Plant Works, “While exploring the inner trap lobes, attracted insect

Photo by Rainer Hedrich, and Erwin Neher

visitors accidentally displace sensory trigger hairs, causing the firing of individual action potentials and rapid trap closure. Ongoing electrical stimulation causes the capture organ to become hermetically sealed, giving the victim no chance of subsequent escape.” As you can see in the picture on the right, this is a simple diagram of what exactly happens and how long things take. “Under the ordinary conditions of the Venus flytrap, it takes two mechanical stimuli within a thirty second period to cause a signal for trap closure, but at higher temperatures even just one stimuli may suffice.” (Brown and Sharp, 1910). It is been known that scientists believe the snap-trap mechanism of the venus fly trap is one of the fastest movements that has been observed in the plant kingdom. Fascinating to say the least, especially for a plant that only grows an average of 13 cm tall with only a 3 cm trap. Crazy to think such small plants can be such a big predator to insects. The picture above in drawing form depicts the three stages of the trap from all the way open to fully closed. The open and closed stages of the trap are rather predictable and understandable. The semi-closed stage is the fraction of a second where the trap is “waiting for further mechanical stimuli to ensure that it has caught a living prey.” (Sami Lehtinen, 2018) Although venus fly traps get nutrients from photosynthesis they live in poor soil and are healthier when they get nutrients from insects as well. All in all, venus fly traps are an extremely fascinating carnivorous plant with so much information to still be learned.

Sources used in this article

Following The Sun

Can you imagine lying down and facing the sun all day, everyday? As amazing as it would be at first I’m sure it would get to be too much after a while. But sunflowers live for the sun, they use a process called heliotropism to follow the sun’s movement; which is also known as solar tracking. Authors Joshua Vandenbrink, Evan Brown, Stacey Harmer and Benjamin Blackman who wrote Turning heads: The biology of solar tracking in sunflower state that, “during the day, the shoot apex continuously reorients, following the sun’s relative position so that the developing heads track from east to west. At night, the

Figure 1. Photo Credits: Stacey Harmer

reverse happens.” As, you see in the picture this is a graph of how fast and often the head of the sunflower turns compared to the time of day and direction of sunlight. Sunflowers start their day facing the east move to face the west during the day but then by the time the sun goes down they are back facing the east. Other plant biologists from UC Davis have now figured out how sunflowers use their internal circadian clock, acting on growth hormones to follow the sun while they grow. “The plant anticipates the timing and the direction of dawn, and to me that looks like a reason to have a connection between the clock and the growth pathway,” Harmer said. The light from the sun allows the sunflower to grow more rapidly. Once the sunflower has grown to maturity they stop following the sun. It really is crazy to think that Sunflowers don’t just use the sun for energy and food but they also use it for growth. It’s been proved that the east and west side of the Sunflower stem grow at different rates and times based on whether or not that side of the stem is facing the sun. Scientists Hagop Atamian, Nicky Creux, Evan Brown, Austin Garner, Benjamin Blackman, and Stacey Harmer who wrote Circadian regulation of sunflower heliotropism, floral orientation, and pollinator visits have investigated the heat levels of sunflowers when in the sun and whether or not there is any ecological advantages. They hypothesized that, “eastward orientation may promote sunflower attractiveness to pollinators through increased morning interception of solar radiation.”

Photo by H. Atamian, N. Creux, E. Brown. A. Garner,
B. Blackman, S. Harmer

In figure 2 you can see that the flower heats up more in the morning when it is east-facing. With this it was also shown that pollinators showed up five times more in the morning when the sunflower is warmer rather than in the afternoon when the sunflower is west-facing. All in all, it is rather amazing how Sunflowers are able to detect the rays of the sun and move accordingly in order to grow.


Look here for sources