Data – Results
Below are the charts that were included on the poster that was created for the SURF poster session on October 18th, 2019. You will see data on yield weights for the individual varieties, disease ratings for each variety over a four week period, and the results from the tasting labs. The last chart shows the three data-sets in relation to one another – scale of 100.
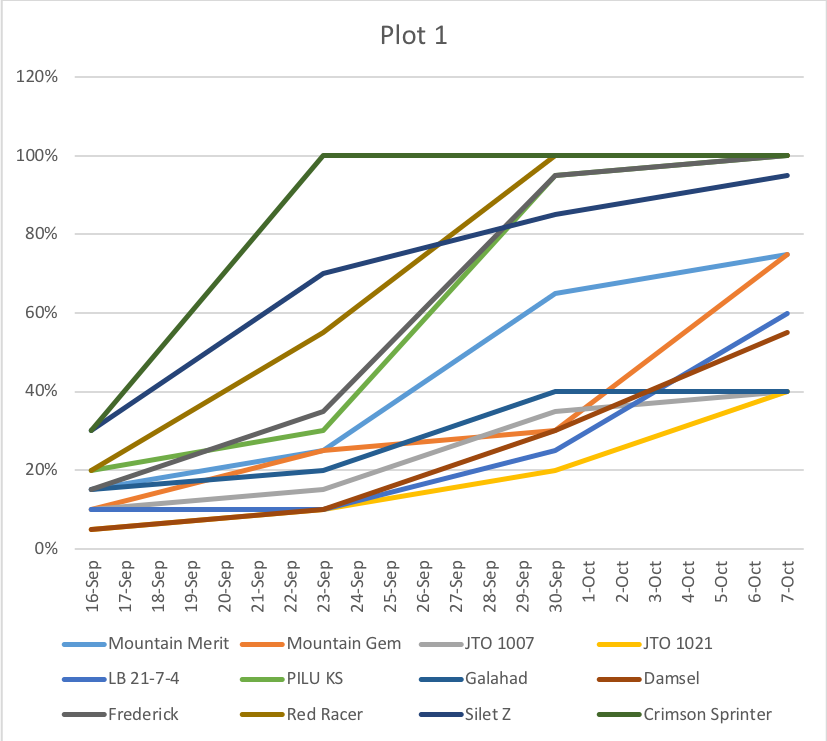
Disease severity over time in plot 1.
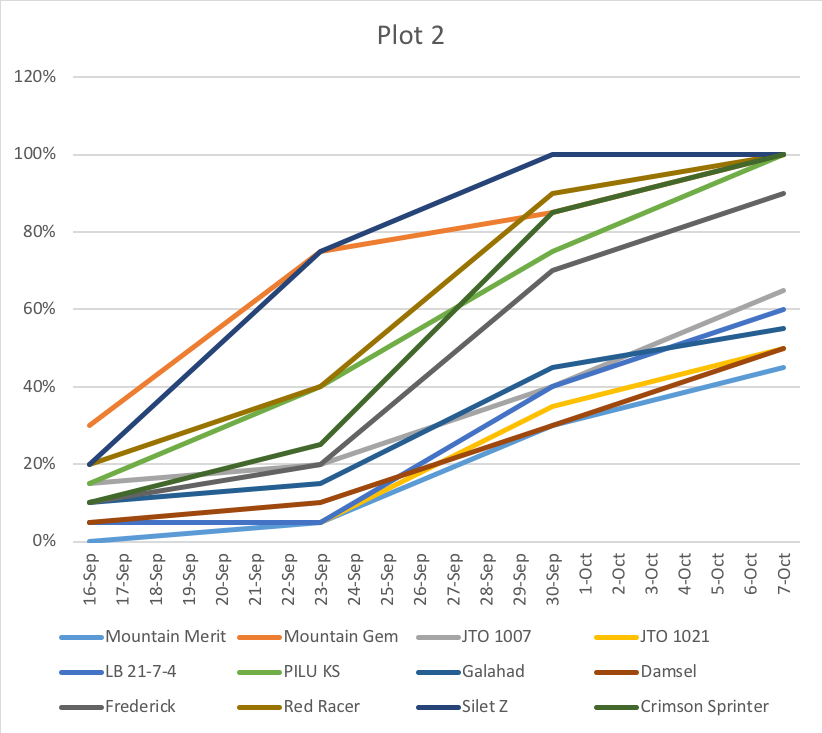
Disease severity over time in plot 2
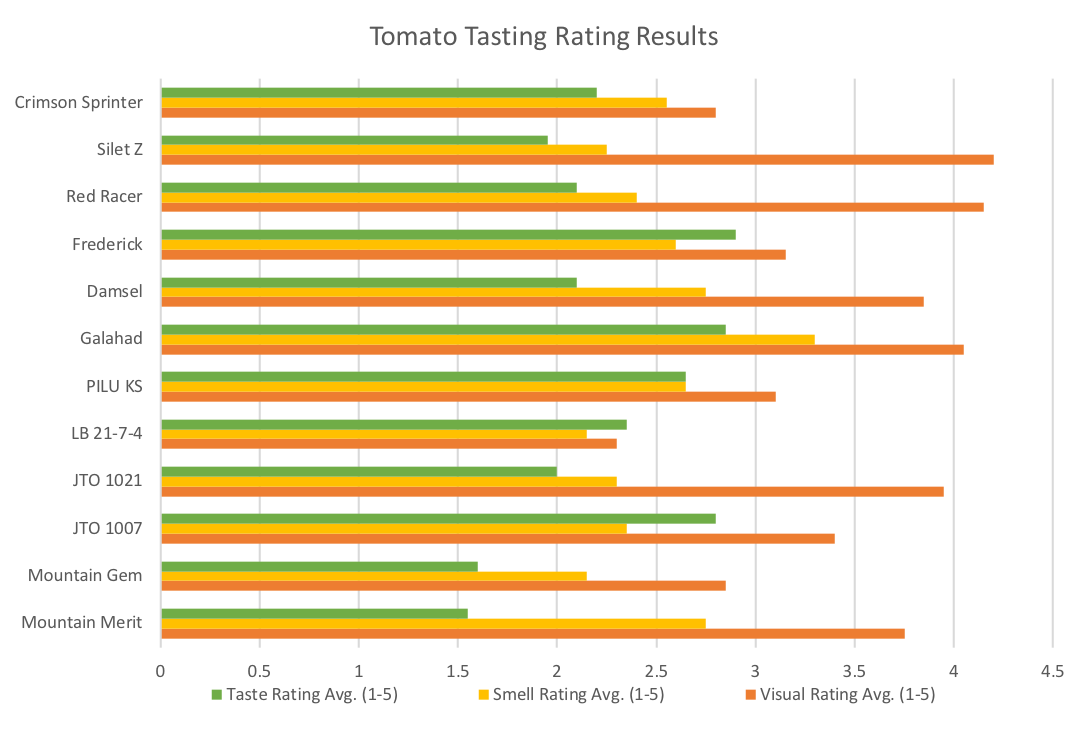
Tomato tasting results for individual tomato varieties with attention to sight, smell and taste. (n=30)
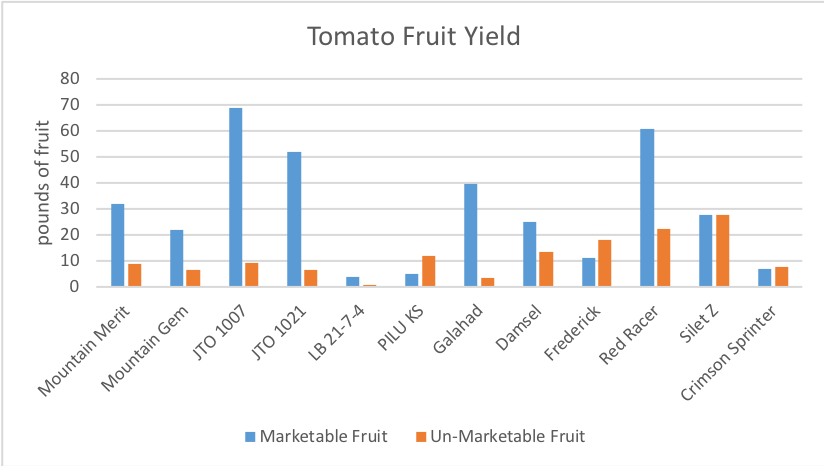
Yield results for both plots from 5 consecutive harvests (lbs)
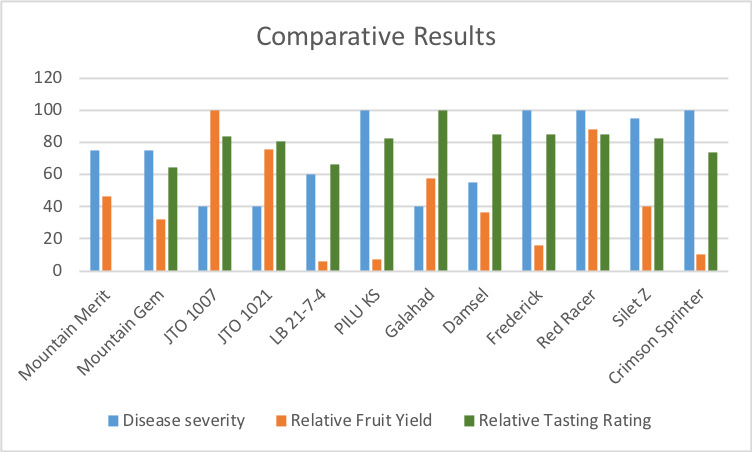
The results from disease severity, fruit yield and the tasting ratings relative to each other on a scale of 100.