Hey y’all, Shani here.
I was looking over my cash flow spreadsheet and lookin’ at my billable hours and thinking the way the time I spend on the different products will wax and wane throughout the year. There is a cyclical pattern to this work flow, especially because it’s seasonal. So I went over to the KidZone and made a free graph, with my hours on the y axis, the month and year on the x axis and the data points with the amount of hours I spend on a different product each month.
Check it out.
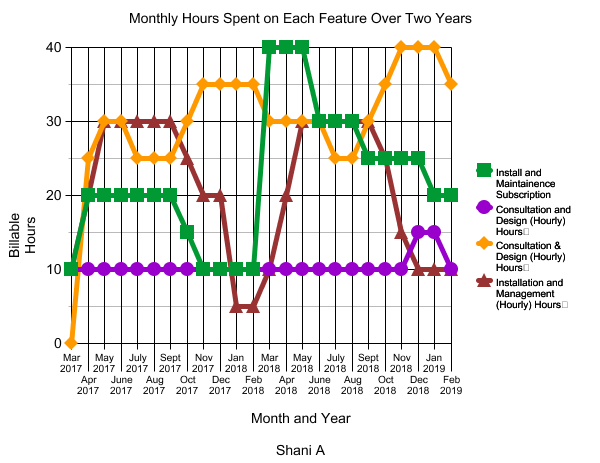
I hope it’s not too grainy on y’alls’ ends. Well, there it is. There is an obvious cyclical pattern. I do more maintenance and installation for my 6 month subscribers, which increases dramatically in year 2. I rely on consultation and design work for established clients (projects) to take up the bulk of my time, especially in winter. I install and maintain landscapes for the clients who aren’t subscribers mostly during the growing season, with very little recruitment in the winter months. And I give myself mainly 10 hours a month to consult and design for new clients as part of the recruitment process.
I like how my work flow slows down just in time for tax season.
Lemme know what y’all think!
Shani A