How can maps help people navigate and understand an area better?
My goal is to create a 3D map of downtown Olympia that will be comprehensible and tangible to people struggling to understand the area. I will color code different types of businesses and locations to help guide people in their errands and adventures. I think maps are important to efficiency of getting around and I believe that the most useful type of map is one that brings the feeling of an area to the user.

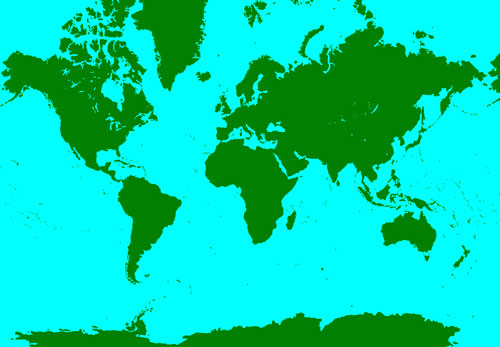
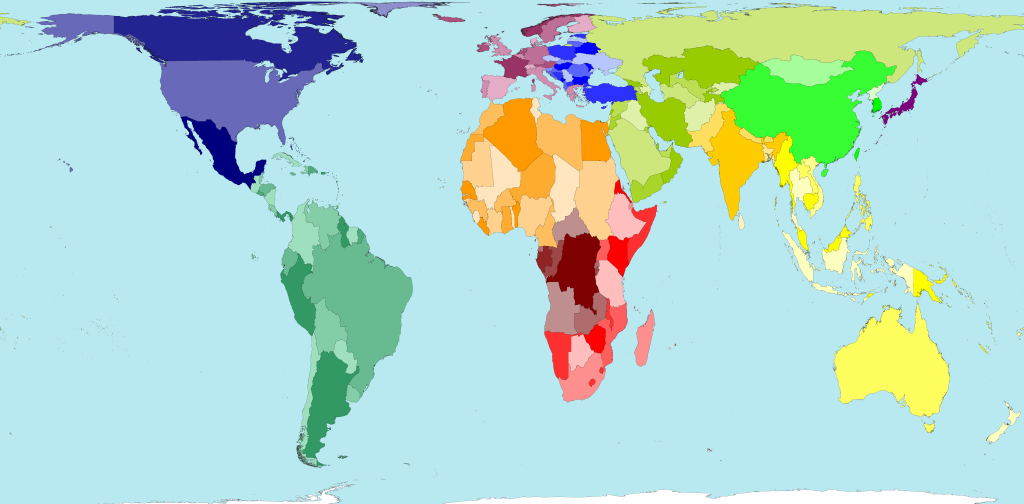
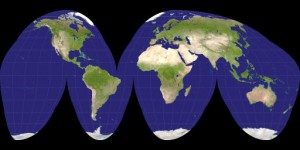
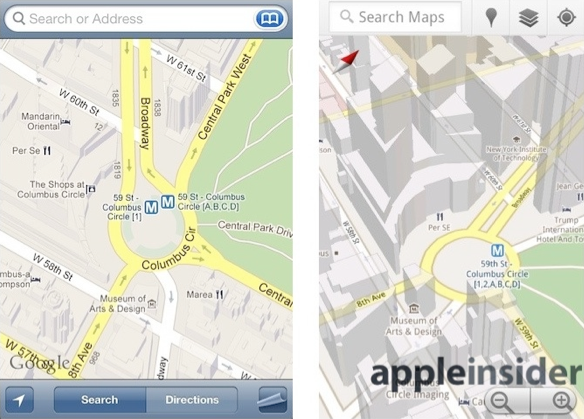
By looking at the images above, one can see that map images try their best to convey an area, but attempting to exhibit a spherical object like the earth, as a flat image is impossible to do without distortion. 3D representation of a location is the most useful and least distorted type of representation (if done properly). This is why a globe is the superior model of the earth – it essentially is a mini-earth. Of course regular 2D printed maps can be very useful in navigation, but it depends on how the map is designed, and it depends on the interpretation of the person using the map. It takes a certain type of mind to relate a flat image to one’s surroundings in order to orient themselves and navigate from that.
With 3D representation, there is little to be interpreted. A tangible mass, modeling a city, puts your mind within the buildings allowing you to understand the layout and the sensation of the area. Becoming familiar with such a model will make a person relate to the area as if they are familiar with it itself. There’s little translation to be done.
Jeffrey Ambroziak is a cartographer from the United States. He is known for his invention, the “Ambroziak Infinite Perspective Projection” which is a form of 3D mapping. His development includes the third dimension of objects within images without distorting them. Distortion is a common problem among cartography since maps often try to relate 3D objects or areas to flat paper or screens. “Ambroziak doesn’t consider these kinds of images to be truly 3-D, as viewers must look at them from a specific distance and angle. Glancing from the sides, or walking toward or away from the image, distorts or destroys the illusion.” As a young man Ambroziak struggled to accept this distortion in maps and eventually developed a way to avoid it.
Recently he had a KickStarter project raising money to create a 3D map of the moon. He used data released by NASA to put into his program and develop the map.
“NASA put out some amazing digital elevation data of the moon late last year, but nobody had released it in true 3-D. So I decided I would,” –Jeffrey Ambroziak
What is “true 3-D”?
“A three-dimensional model that displays a picture or item in a form that appears to be physically present with a designated structure. Essentially, it allows items that appeared flat to the human eye to be displayed in a form that allows for various dimensions to be represented. These dimensions include width, depth, and height.”
The above definition of “true 3-D” says that for something to be 3D it has to display something in a form that “appears” physically present. I want to make something that actually is physically present. It will be exactly what it is showing people. There will be no possibility of distortion anywhere because its appearance does not depend on its viewers.
Unlike the idea for my project, Ambroziak’s map is 3D in the sense that a 3D movie is. He refers to it as “true 3D” because one can move with the image without distorting it. However, they still need 3D glasses and they cannot touch and feel the dimensions. This is why I aspire to create a map or model that is a tangible 3D representation of Downtown Olympia.
3D images are definitely getting popular these days. As someone who has an affinity for cartography, I truly appreciate maps that include the third dimension.
Recently Apple and Google have introduced 3D maps to their mapping programs and it is clear that the 3D versions are far superior. Just by looking at this image you can see how much better the right map is at displaying the area. I think moving cartography in the direction of 3D will make a big difference in map usage. I see people becoming less frustrated and less lost. Using the map on the left would almost discourage me from trying to acquaint myself with an area, whereas the map on the right excites me.
“Yale Bulletin and Calendar – News.” Yale Bulletin and Calendar – News. N.p., 21 Jan. 2000. Web. 19 Oct. 2014.
I really like the idea of having a visual, touchable city map as opposed to a 2D aerial view. Your opening question brought a new level to my understanding of maps. Through use of your images, your point was made that all maps are not, in fact, equal. Although you articulated the various other similar projects to yours, I would like to see more about your plans to map and print the city. Your citations looked perfectly done, and they were in reference to material that is very relevant to your map idea. I can’t wait to see further developments being made on this project!
The importance of cartography through its relationship with human interaction and social mobility is adequately imposed through your visual comparisons of mobile device mapping. Becoming enticed with 2 dimensional imagery is notably hard for me, and uncovering directional use or purpose of cartography is essential to understanding where to go or where to start in terms of travel. I appreciate your comparison of 2 dimensional formats of mapping with 3 dimensional formats, also including the variable of personal/ self interpretation. Including Ambroziak’s innovation of 3 dimensional cartography is crucial to your own manifestation and helped me as an observer gain a more acute visual perspective of your project’s purpose. I am excited to see your final printed representation and what details you choose to include and dismiss based off of your establish comparisons!
The idea is to create a 3D map of downtown Olympia, and that this will create a better way to navigate and familiarize oneself with the area. The images show maps that give examples of how a traditional map has a sort of disconnect with how an area actually exists, as well as the direction that maps seem to be heading and how they are a better alternative. The idea explains how 3D maps offer a better way to understand an area. It shows the world as it actually exists, and how we experience. The idea is important because it offers a better way to get to know the world. As an Olympian, I have looked at maps of the area countless times, but I still don’t have a good feel for it. This idea excites me. The external sources offer examples of how maps are already evolving into a more 3D format, and how good and cool that is. This project will create a way to better get to know the downtown Olympia area, as well as pave the way for similar creations of maps of other areas anywhere in the world. This is worth spending a quarter on because it will actually make a difference in how people can understand a geographic area. It is a really cool idea and I am very excited to see the outcome.