Golden CST
Reply
My Blue Rabbit idea started out with a focus on cartography and now I think it leans much more towards architecture. As I learned how established and beneficial 3D rendering is to the field of architecture, it drew my attention towards design representation rather than informational representation. I still believe that 3D rendering and printing is absolutely an amazing tool in representing physical concepts/data.
For me personally in my experience with the Blue Rabbit project, I found it difficult to represent something as is. I believe the reason for this is that I am not very good with the software what so ever. With my current level of skill, I would probably be better off drawing from my head and learning what I can do and design rather than stressing over accuracy of map representation. However, I wanted to carry out my original idea. There wasn’t really time to start over and I did still believe in it. I still believe that printing a 3D map of downtown Olympia is important because it will better its viewer’s understanding of the location being represented. Unfortunately I don’t yet have the skill to make an accurate rendering that can be a reference tool, beyond just getting the point of 3D representation across. This is why I feel as though if I could do the Blue Rabbit project over again, I would probably try to design a future home for myself or design a building of some other function. It would be more of a design themed drawing experience than a reporting themed experience.
I have always liked architecture and doodling floor plans for homes. My favorite part of The Sims was making the houses. I’m not particularly creative but designing is something I enjoy doing and something that I see being useful in my future. My dad told me that architecture might not be the best field to go into because when the economy plummets, architects are the first professionals to become unneeded. Apparently when money is tight people no longer feel the need to utilize another’s expertise in their personal designs. It becomes a DIY thing. My response to this was that I don’t want to practice architectural skills because I want to be an architect, I want to practice them so I can successfully “do it myself” when I someday don’t find it necessary to seek professional architectural assistance in building my home or other type of building.
Here is my current 3D rendering of a section of downtown Olympia:
Dimensions: 128.81×132.82×25.04 (mm)
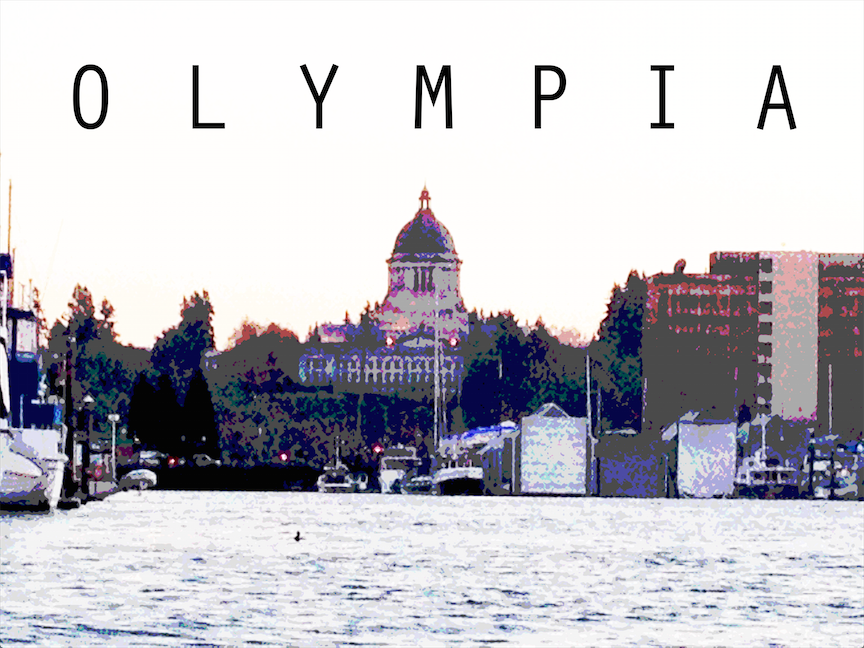
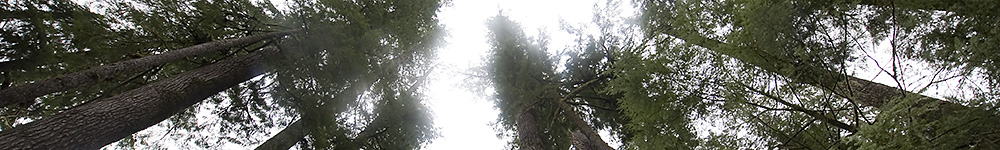
Washington State Capitol, viewed from a dock (Hannah Forbes)
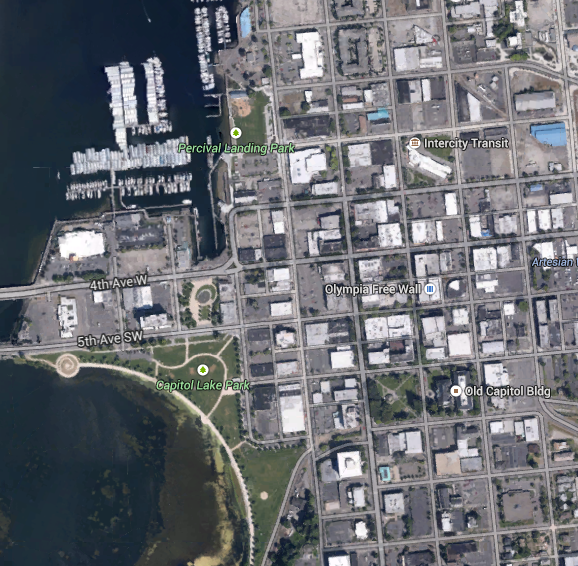
Downtown Olympia screenshot from Google Earth
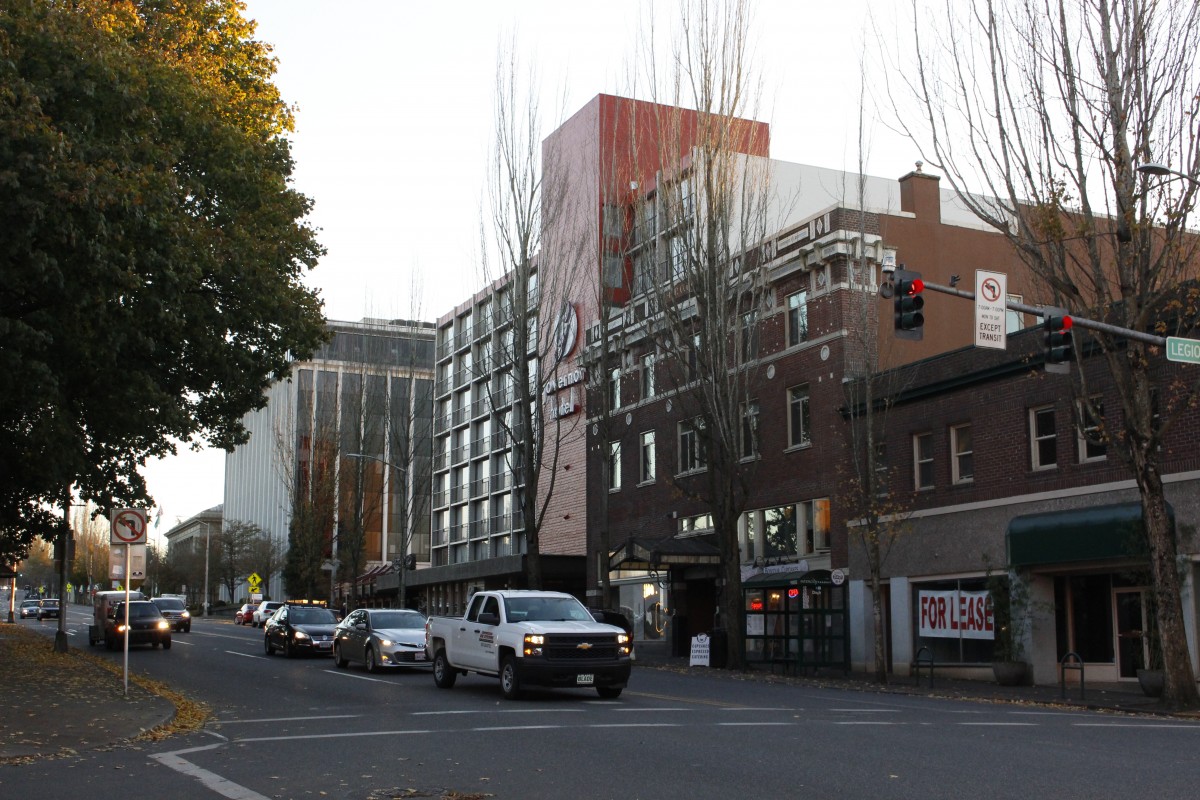
City block by the park (Hannah Forbes)
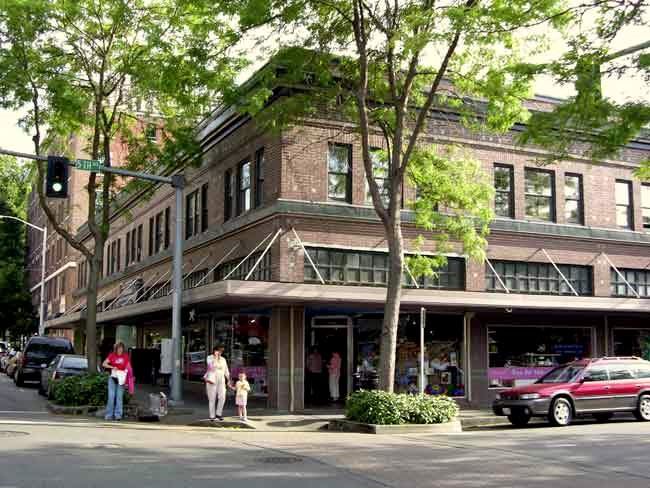
Street corner viewed from across an intersection (Susan Perish)

A sidewalk lined with restaurants, hanging jellyfish lights (Hannah Forbes)

City street after midnight (Hannah Forbes)

So many boats. So important to Olympia (Jim Nieland)

Screenshot of building development in tinkercad
How can someone experience Olympia even without being there?
Olympia is a beautiful city. Unfortunately, it is nearly impossible to see that from an aerial view or a map. To experience the beauty and to feel the vibes of the city it is important to be within it—to be able to view surroundings from many different angles. Capturing Olympia’s essence in photography is a step in the right direction, but imagine viewing the city by means of a 3D physical model. It would be like a miniature Olympia that you can hold in your hands or set up on your desk.
Digital representation can be great. It can document and enhance scenes. I think a digital version of this 3D rendering of Olympia would maybe be more practical. It could be used as an app on a cell phone to be pulled up and used anytime. Especially if the rendering is very realistic and can be moved around in all different angles, it would be just as useful as the physical version, most likely. But I think that it is worth bringing this idea into physical existence because there’s something about being able to touch and move what you’re looking at. I believe people would be more interested in viewing the model for a decent amount of time if it was a physically present model. It wouldn’t necessarily be more useful, and definitely not more practical than the digital version, but I believe it would be more enjoyable and exciting.
“Seeing is Believing”
How do 3D printed models or maps enhance representation?
I believe that 3D representation gets the point of physical objects across best, which is why studying a map that is 3D printed and physically present can help one understand an area better than a flat map image. I came to this idea because the concepts of representation and perspective have always been interesting to me throughout my life. I’m someone who always likes to see things from different angles and I try to contemplate how ideas or data might be better represented and therefore better understood. I’m excited to make a 3D model of at least part of downtown Olympia. Even if I’m the only viewer of it, I know it will better my understanding of the area.
In doing research for this project, I struggled to find sources (that were accessible and understandable to me), which pertained exactly to my idea. It surprised me that it was so difficult to find cartographers interested in 3D mapping, since distortion is such a huge part of 2D mapping. Instead I found examples of my idea demonstrated in Architecture and models of building designs. I came across pages for different companies explaining how 3D printing or 3D rendering/modeling has made a huge difference on the way they do business. Rietveld Architecture Firm perfectly describes why 3D rendering is important for clients’ understanding of designs, and also how 3D printing their designs allows for many more models of various scales and iterations to be made more quickly and efficiently. 3D printing these necessary models also allows for more detail to be incorporated, which provides easier understanding for the viewers.
“During the course of a typical project, Rietveld, like other architecture firms, builds numerous models in increasing detail and scale that help clients to visualize designs. And, like other firms, they had traditionally built these models by hand – a task that usually required two employees to spend upwards of two months cutting, assembling and finishing components made of cardboard, foam board and Plexiglass. The time and expense to hand craft these complex elements dictated that the models have an inadequate amount of detail, limiting the creativity and therefore showcasing a model that sometimes did not sufficiently highlight the selling points of the design.” (Meijs).
Rietveld Architects have been able to take their business a step ahead of their competitors. They say there is always a “wow factor” when they present a 3D printed model. Obviously models are necessary in the architecture industry, in order to examine and appreciate designs. Now 3D printing has brought ease to this very important piece of every project.
Brian Smith and Brian Zajac, founders of 3D Architectural Solutions, are firm believers in the 3D movement and development of the field. They both individually began working on 3D studies in the 90s. While Smith steadily progressed in the field of 3D, Zajac moved to web design, under the impression that work in 3D was not quite worthwhile in those years. Later on he noticed that the world of 3D was quickly picking up actually cost effective (unlike in the 90s) and at this point he and Smith joined to form 3D Architectural Solutions. In 2006 they teamed up with other organizations to form CGschool, which is now the leading company in visualization training.
It is clear that both of these men are very wisely invested in the field of 3D representation. This interest pointed them both in the direction of architecture. The field of architecture is perfect for utilizing expertise in 3D representation, as I talked about before. 3D representation is used for presenting a design most accurately. It is useful to both the designers, and the clients. It is the best way to understand the data in front of you.
“3D Rendering has brought about huge efficiencies in the architectural and engineering industries in recent times. 3D rendering is the process of producing an image based on three-dimensional data stored within a computer.” (The Benefits).
The data used to create these images was already being generated with every design created, but until 3D rendering became a big part of the industry, the only way to understand the design was either by interpreting numerous 2D drawings, depicting different angles, or to use a model which was an expensive, time consuming, detail limiting piece of work… before 3D printing came into the scene.
Representation is key to understanding. In the fields of architecture, mapping, engineering, and others, it is important that people be able to convey their designs, or data they have collected in a manner that makes sense. With anything that exists in three dimensions, the most sensible representation is 3D rendering which is now more than possible but very efficient. I’m excited to create my very own model of the city that is my new home.
Works Cited
“3D Modelization and Visualization.” Open Text. Open Text Corporation, 2011. Web. 02 Nov. 2014.
“The Benefits of 3D Rendering.” AABSys. AABSyS IT, 2014. Web. 02 Nov. 2014.
“Benefits of 3D Rendering and Visualization.” GIS Virtual RSS. GIS Virtual, 08 Aug. 2012. Web. 02 Nov. 2014.
Meijs, Piet. “Examples of 3D Printing in the Architecture Industry.” 3D Printer. Javelin Technologies Inc., 2014. Web. 02 Nov. 2014.
Meijs, Piet. “Objet Technology Enables Architecture Firm to Shave Months Off Model-Building Time.” Case Study. Rietveld Architects LLP, 2010. Web. 2 Nov. 2014.
Smith, Brian, and Brian Zajac. “Why Are 3D Visualization Renderings and Animations Important?” 3D Architectural Solutions. 3DAS LLC, n.d. Web. 01 Nov. 2014.
“The Societal Impacts of 3D Printing.” 3D Printing. WordPress.com, n.d. Web. 02 Nov. 2014.
How can maps help people navigate and understand an area better?
My goal is to create a 3D map of downtown Olympia that will be comprehensible and tangible to people struggling to understand the area. I will color code different types of businesses and locations to help guide people in their errands and adventures. I think maps are important to efficiency of getting around and I believe that the most useful type of map is one that brings the feeling of an area to the user.

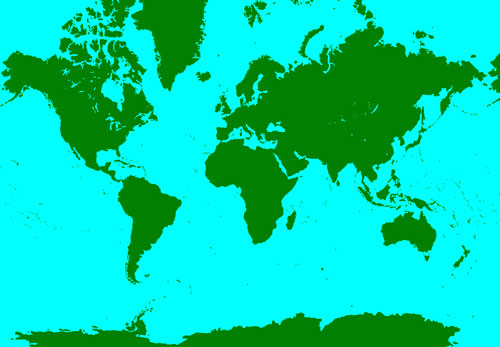
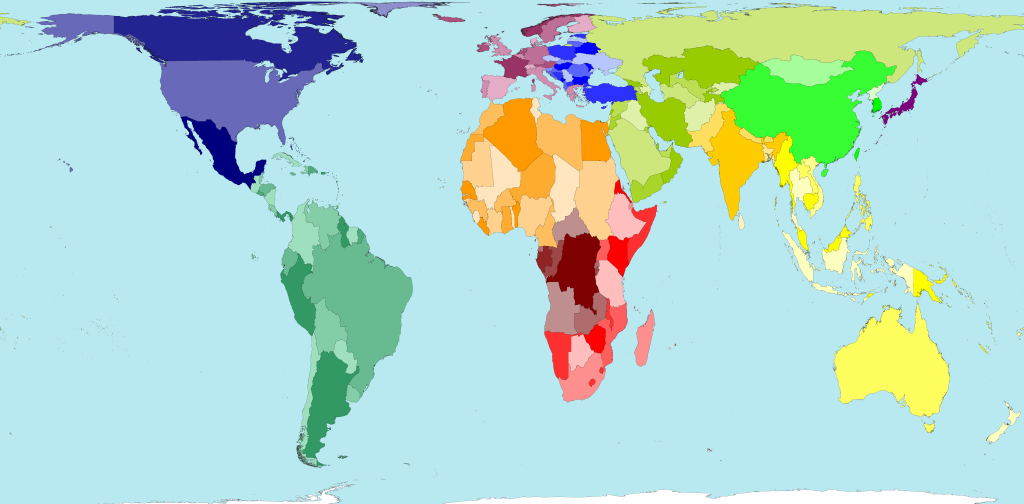
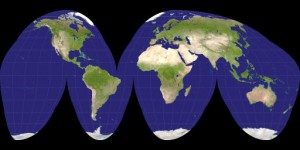
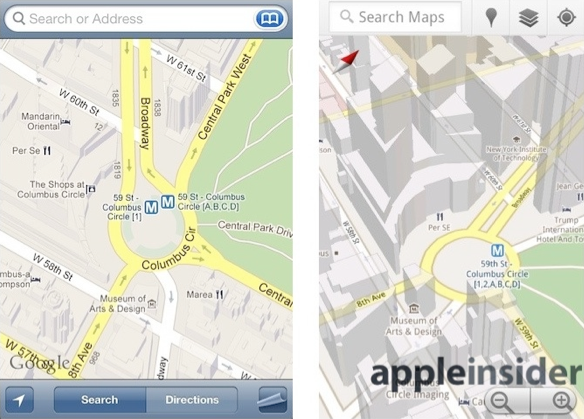
By looking at the images above, one can see that map images try their best to convey an area, but attempting to exhibit a spherical object like the earth, as a flat image is impossible to do without distortion. 3D representation of a location is the most useful and least distorted type of representation (if done properly). This is why a globe is the superior model of the earth – it essentially is a mini-earth. Of course regular 2D printed maps can be very useful in navigation, but it depends on how the map is designed, and it depends on the interpretation of the person using the map. It takes a certain type of mind to relate a flat image to one’s surroundings in order to orient themselves and navigate from that.
With 3D representation, there is little to be interpreted. A tangible mass, modeling a city, puts your mind within the buildings allowing you to understand the layout and the sensation of the area. Becoming familiar with such a model will make a person relate to the area as if they are familiar with it itself. There’s little translation to be done.
Jeffrey Ambroziak is a cartographer from the United States. He is known for his invention, the “Ambroziak Infinite Perspective Projection” which is a form of 3D mapping. His development includes the third dimension of objects within images without distorting them. Distortion is a common problem among cartography since maps often try to relate 3D objects or areas to flat paper or screens. “Ambroziak doesn’t consider these kinds of images to be truly 3-D, as viewers must look at them from a specific distance and angle. Glancing from the sides, or walking toward or away from the image, distorts or destroys the illusion.” As a young man Ambroziak struggled to accept this distortion in maps and eventually developed a way to avoid it.
Recently he had a KickStarter project raising money to create a 3D map of the moon. He used data released by NASA to put into his program and develop the map.
“NASA put out some amazing digital elevation data of the moon late last year, but nobody had released it in true 3-D. So I decided I would,” –Jeffrey Ambroziak
What is “true 3-D”?
“A three-dimensional model that displays a picture or item in a form that appears to be physically present with a designated structure. Essentially, it allows items that appeared flat to the human eye to be displayed in a form that allows for various dimensions to be represented. These dimensions include width, depth, and height.”
The above definition of “true 3-D” says that for something to be 3D it has to display something in a form that “appears” physically present. I want to make something that actually is physically present. It will be exactly what it is showing people. There will be no possibility of distortion anywhere because its appearance does not depend on its viewers.
Unlike the idea for my project, Ambroziak’s map is 3D in the sense that a 3D movie is. He refers to it as “true 3D” because one can move with the image without distorting it. However, they still need 3D glasses and they cannot touch and feel the dimensions. This is why I aspire to create a map or model that is a tangible 3D representation of Downtown Olympia.
3D images are definitely getting popular these days. As someone who has an affinity for cartography, I truly appreciate maps that include the third dimension.
Recently Apple and Google have introduced 3D maps to their mapping programs and it is clear that the 3D versions are far superior. Just by looking at this image you can see how much better the right map is at displaying the area. I think moving cartography in the direction of 3D will make a big difference in map usage. I see people becoming less frustrated and less lost. Using the map on the left would almost discourage me from trying to acquaint myself with an area, whereas the map on the right excites me.
“Yale Bulletin and Calendar – News.” Yale Bulletin and Calendar – News. N.p., 21 Jan. 2000. Web. 19 Oct. 2014.
Red Rabbit