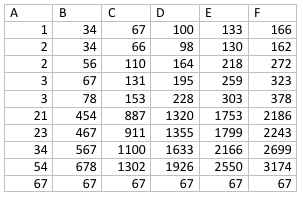
Graphing data in Excel is easy, but like most programs, a lot of different options are presented. A simple chart can be good, and sometimes better, than a complex chart in which every option Excel has is utilized. Creating different types of charts is a great way to show data in a visual, clear way. Using different styles and approaches will make your data all the more impressive and stimulating. Since the purpose of this article is to learn a little more about how to do just that, let’s use the data below to demonstrate what Excel has to offer.
Then just use the Insert tab, under the charts submenu, to select any graph type. Don’t worry if you don’t like the one selected, because you can change your chart type at any time under the “Design” tab that shows up once you’ve created a chart.
The three new tabs that now apparent in the spreadsheet are: Design, Layout and Format. This is where most of the chart options can be found. The Design tab should be pre-selected. All the way to the left is a little button that says Change Chart Type. This setting is in most versions of Excel, as well as other spreadsheet programs, but may be in different places or be called something different. Go ahead and select Change Chart Type, then watch the options explode all over your eyeballs.
Don’t be intimidated: you’re the boss here, and you get to tell Excel what’s up with your data. Keep in mind that these chart types are not universal fits for all data sets. For example, you can’t use a pie chart for a ton of columns and rows full of data, and on the flip side, using an area graph for a single column or row of information wouldn’t be taking advantage of the benefits that type of graph offers for large data sets. The way to know what type of graph is best for your data is to explore the different types of charts you’re offered and then determine which chart type best reflects the entirety of your data, or the subset you’re trying to graph.
Probably the most versatile and common chart type is the bar or column graph. You can graph large or small data sets of varying complexity in this type of graph. Pie charts, as stated, are good for one column of data, but doughnut graphs can deal with multiple columns in concentric circles. It’s rely neat! Under the layout tab, there are options for inserting pictures or shapes into your graph, if you want to spice things up. You can add labels to your axes, or title your chart under the Labels submenu as well. Also, you’ll find font and color options under the Format tab in their appropriate submenus. There are a ton of other options to play with, and if you’re unfamiliar with anything, click it! That’s the best way to learn. Remember Edit > Undo for the bigger mistakes.
Comments are closed.