To analyze Brix levels, we took 5 fully ripe fruit from each plot, labeled them, and froze them. This sample collection occurred during Harvest 2 for each variety. When all the samples had been collected and stockpiled in my freezer, I thawed them overnight and proceeded to crush them, so they became tomato slurry. This slurry was used with a refractometer to get a single reading for each plot.
For those that aren’t familiar, Brix measurements are an approximation of the amount of sugar dissolved in an aqueous solution, and works based on light refraction. One degree Brix refers to 1 gram of sucrose being dissolved in a 100 gram solution. While it’s certainly not all-encompassing, Brix measurements are used frequently in food and beverage industries to determine produce/product quality.
Standard ANOVA tests are again used here, since Brix is continuous and our varieties are nominal. (Sorry to be so repetitive with these things; I’m just walking everyone through my thought process.) So far we’ve lucked out on the distribution of our data. The Brix distribution doesn’t stray from normal enough to warrant any sort of transformations. Because I was curious, I did look at the distribution after log and ln transformations, but the distribution actually got less normal than the raw data.
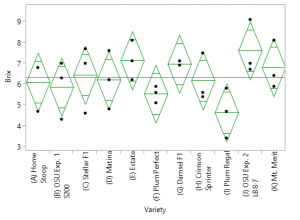 Here’s a graph of the Brix samples. Check out the most extreme: OSU LB8-7. I wouldn’t expect plum tomatoes to be the highest testing varieties (and the others weren’t). I tested this one several times just to be sure, but that 9.1 degrees Brix held. Perhaps this is part explanation for why they smell and taste so damn good after being roasted. ANOVA results (F=1.48, P=.21) do not indicate significant differences between varieties. More data I think would be useful here because there are definitely “significant” differences in taste and flavor! Although this does illustrate how Brix readings are only a proxy for quality. Since no significant differences were found, I’m following the UW-Madison lead of ranking the varieties instead; see the table below for raw data and rankings.
| Variety | Block 1 | Block 2 | Block 3 | Average | Rank |
|---|---|---|---|---|---|
| (J) OSU Exp. 2 LB8-7 | 6.7 | 7.0 | 9.1 | 7.60 | 1 |
| (E) Estate | 8.1 | 6.2 | 7.1 | 7.13 | 2 |
| (G) Damsel F1 | 7.1 | 6.9 | 6.9 | 6.97 | 3 |
| (K) Mt. Merit | 8.1 | 5.9 | 6.4 | 6.80 | 4 |
| (C) Stellar F1 | 7.7 | 7.0 | 4.6 | 6.43 | 5 |
| (D) Matina | 4.8 | 6.2 | 7.6 | 6.20 | 6 |
| (H) Crimson Sprinter | 5.6 | 7.5 | 5.4 | 6.17 | 7 |
| (A) Home Stoop | 4.7 | 6.8 | 6.8 | 6.10 | 8 |
| (B) OSU Exp. 1 S200 | 6.3 | 7.0 | 4.3 | 5.87 | 9 |
| (F) Plum Perfect | 5.6 | 5.1 | 5.9 | 5.53 | 10 |
| (I) Plum Regal | 5.8 | 3.4 | 4.7 | 4.63 | 11 |
Leave a Reply