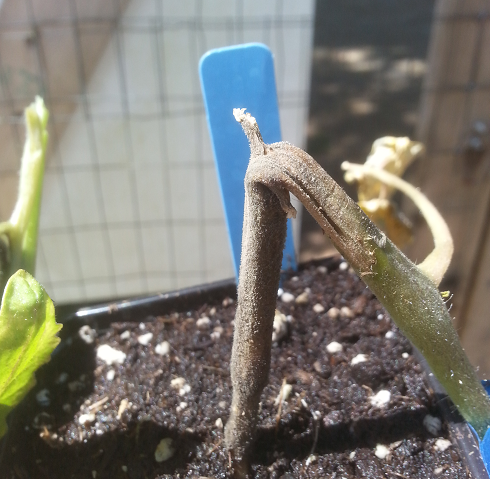
Photo: A seedling on the way to the compost pile. Preformed defenses (ie: the physical and chemical barriers of the epidermis and cuticle layers) are the first line of plant defense, and are actually quite effective at halting pathogen assaults. The stem on this plant was snapped, compromising these defenses and facilitating easy entry and proliferation of a pathogen. I think this is the Fulvia sp. trapped in the farm’s greenhouse.
So late blight was spotted a few weeks ago, and scores for the disease are being recorded every Friday. There is certainly variability among the plants, which is always fascinating to see: two tomatoes side-by-side, one practically dead and the other still green and beautiful, but WHY!? We’ve been dealing with various diseases and pathogens since very early on in the trial, so this analysis is to describe how plants held up to non-late blight disease pressure.
Since I used ordinal scales to score disease severity in the field and greenhouse, goodness-of-fit analysis is required. Once again I used Pearson’s chi squared. To be clear, I am not very adept at statistical analysis, and what I do know is mostly self-taught, or remnant from a field ecology class I took back in the day. If the chi squared value proves significant, I know differences exist. But when it comes to post-hoc analysis of ordinal data – I’m not sure if there is any equivalent of Tukey’s HSD. If there is I haven’t really found it; if you know it, then you should tell me. 🙂
The stats program I use (JMP by SAS) generates a contingency table, which can help enlighten us with some of this. A contingency table takes into account expected values under the null hypothesis, and can also be manipulated to show what percentage of the total can be attributed to a factor. For example, the most severely infected plants received a score of 3, which meant “severe/lethal.” A contingency table tells me that over 50% of all 3s given as a score occurred in the greenhouse. This supports concluding disease severity was most severe in the greenhouse, but it doesn’t tell me why. Pressure could’ve been higher, or symptoms could have been exacerbated by a pathogen-host relationship – who knows? The following passages are excerpts from the trial report I’m working on that summarize the analysis of (non-late blight) disease severity for the trial plants.
——-
“On May 4th, tomato starts were relocated to a transitional unheated greenhouse to begin the hardening off process. Disease pressure soon became evident among the trial plants. Scoring for disease severity in the unheated greenhouse occurred May 15th with a single score for each variety. Scores ranged from 0-3 with 0=absent/virtually undetectable, 1=slight damage/pressure, 2=moderate damage/abundant, 3=severe/lethal levels as outlined in the NOVIC trial protocol. Diseased tissue was then pruned with scissors and removed; pruning infected tissue occurred as needed until plants were transplanted into the field.
As many plants showed continued and new signs of disease, disease and pest pressure was again scored on July 20th using the same 0-3 scale for scoring disease severity in the greenhouse. One score was given for each plot in each replicate….On July 31st, samples of the most severely diseased plants were sent to Jenny Glass at Washington State University Puyallup Research and Extension Center’s Insect and Plant Diagnostic Laboratory (Puyallup, WA). A series of leaf cuttings were taken from OSU S200 (Block 3), Stellar F1 (Block 1), Crimson Sprinter (Block 3), OSU LB8-7 (Block 1), and Matina (north edge), then labeled and placed individually in Ziploc bags before being mailed.
By the second week of September, scouting for signs of late blight happened bi-weekly alongside harvests on Tuesdays and Fridays. Before late blight was spotted in the field, each plot was scored a second time on September 12 using the 0-3 scale for disease severity in order to establish a baseline of tissue damage and hopefully help distinguish between damage caused by P. infestans and damage caused by other pathogens.
Results
Disease and Pest Pressure
Flea beetles proved voracious soon after transplanting into the field, but did not seem to exhibit any preference in terms of variety.
Jenny Glass and her team at the WSU Lab expediently ran many diagnostic tests on samples submitted July 31 and identified several pathogens. Spores from Fulvia (formerly Cladosporium, and most likely F. fulva), the causal agent of tomato leaf mold, were found on all samples. Tomato leaf mold is common in high-humidity greenhouses, and most likely provided the disease pressure early in the trial while transplants were hardening off. Alternaria alternata spores were also identified on “many” of the samples, while Ulocladium spores were found on Matina samples. Composite testing also revealed sporulation patterns associated with Verticillium, a positive response for Cucumber Mosaic Virus (CMV) and a faint (but not altogether positive) response to Tobacco Mosaic Virus (TMV). Notably, one Plum Perfect individual was rogued early in the trial while plants were hardening off because it showed clear signs of viral infection.
Distinguishing damage attributed to specific diseases or causal agents proved too difficult and seemed precarious, so data analysis was done for overall disease severity; this analysis does not include late blight severity scores. When disease severity was analyzed by variety, Pearson’s chi squared returned a critical value of 53.88 (P=.005) indicating significant differences attributable to the plant variety. Home Stoop, Estate, Damsel, Mountain Merit, and Plum Perfect appeared to be the most tolerant and/or resistant to the disease pressure in both the greenhouse and field. Stellar, OSU S200, Plum Regal, and OSU LB8-7 showed more moderate or highly variable susceptibility, while Matina and Crimson Sprinter plants presented the most severe infections.
Disease severity was also significantly affected by location (field blocks or greenhouse) as indicated by a critical value of 21.69 (P=.01). The greenhouse fostered the most severe infections, but field Block 2 appeared to have more severe symptoms than Blocks 1 and 3. While the field exhibits wide variability in terms of light intensity, Block 3 is the most shaded, so the increased severity in Block 2 is somewhat perplexing. Researchers propose greater diversity or amounts of soil-borne pathogens and/or propagules in Block 2 as a possible explanation.”
Leave a Reply